01
What is Power Factor?
-
Power Factor (PF) is the ratio of real power to apparent power in an AC circuit
-
Mathematically:
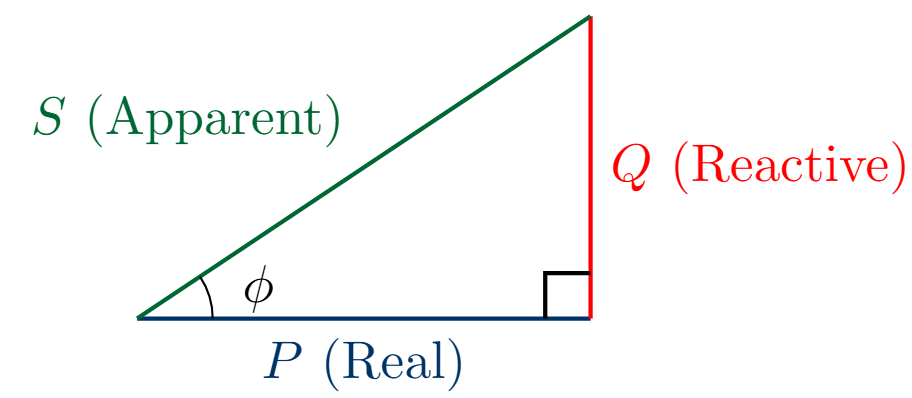
where:\[\boxed{\text{PF} = \frac{P}{S} = \cos\phi}\]-
\(P\): Real power (Watt)
-
\(S\): Apparent power (VA)
-
\(\phi\): Phase angle between voltage and current
-
-
Range: \(0 \leq \text{PF} \leq 1\)
-
Unity PF (PF = 1): Ideal condition
02
Types of Power in AC Circuits
-
Real Power (P): Power that does actual work
\[P = VI\cos\phi \text{ (Watts)}\] -
Reactive Power (Q): Power stored and released by reactive elements
\[Q = VI\sin\phi \text{ (VAR - Volt-Ampere Reactive)}\] -
Apparent Power (S): Total power supplied to the circuit
\[S = VI \text{ (VA - Volt-Ampere)}\] -
Relationship:
\[S^2 = P^2 + Q^2\]
Key Point
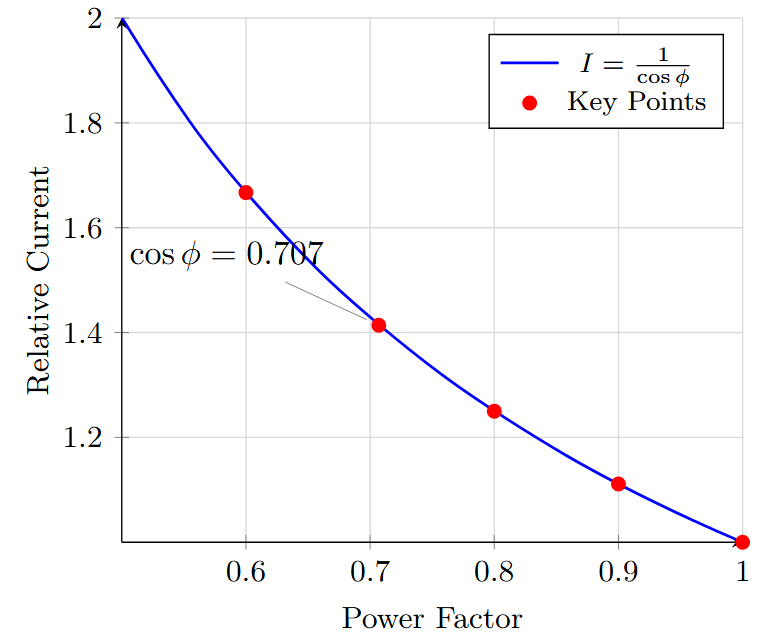
Low power factor means higher current for the same real power, leading to increased losses and reduced system efficiency.
03
Power Factor Categories
| Power Factor | Category | Load Type | Current |
|---|---|---|---|
| PF = 1.0 | Unity | Resistive | In phase with voltage |
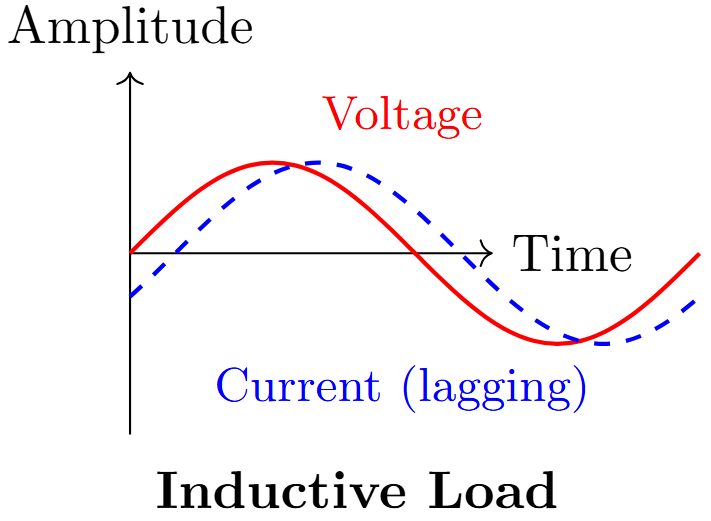
| PF \(<\) 1.0 (lagging) | Inductive | Motors, Transformers | Lags voltage |
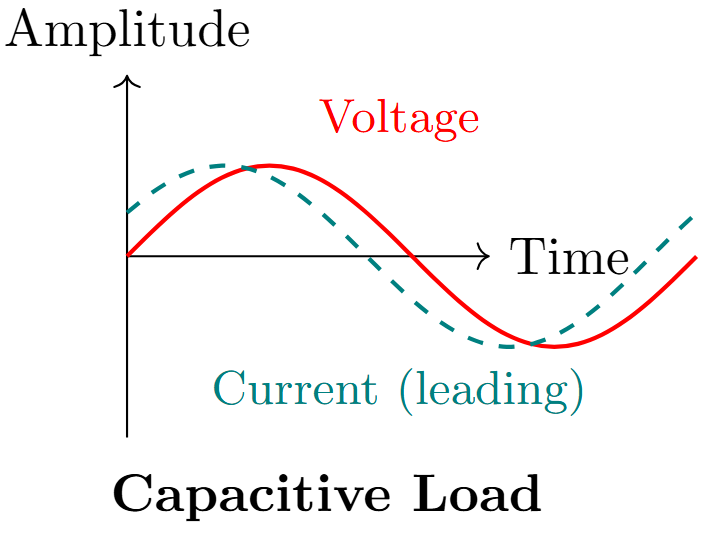
| PF \(<\) 1.0 (leading) | Capacitive | Capacitor banks | Leads voltage |
04
Why is Power Factor Important?
-
System Efficiency: Higher current for same real power
\[I = \frac{P}{V \cdot \text{PF}}\] -
Power Losses: Increased \(I^2R\) losses in transmission lines
\[P_{\text{loss}} = I^2R = \left(\frac{P}{V \cdot \text{PF}}\right)^2 R\] -
Voltage Drop: Higher current causes greater voltage drops
-
Equipment Rating: Generators, transformers must be oversized
-
Economic Impact: Utility penalty charges for poor PF
Example
For a 10 kW load at 0.5 PF vs. 0.9 PF:
-
At PF = 0.5: \(I = \frac{10000}{230 \times 0.5} = 87\) A
-
At PF = 0.9: \(I = \frac{10000}{230 \times 0.9} = 48\) A
Current reduction: \(45\%!\)
05
Economic Impact of Poor Power Factor
Utility Penalties:
-
Most utilities charge penalties for PF \(<\) 0.85-0.9
-
Typical penalty: 0.5-2% per 0.01 below threshold
-
Demand charges increase with low PF
Infrastructure Costs:
-
Larger conductors required
-
Oversized transformers and switchgear
-
Reduced system capacity
Cost Savings
Improving PF from 0.7 to 0.95 can reduce electricity bills by 15-25% in industrial applications.
06
-
Inductive Loads
-
AC motors (especially lightly loaded)
-
Transformers (on no-load or light load)
-
Inductors, reactors, and chokes
-
Fluorescent lighting with magnetic ballasts
-
-
Non-linear Loads
-
Power electronic converters (rectifiers, inverters)
-
Variable frequency drives (VFDs)
-
Switching power supplies
-
Electronic ballasts and LED drivers
-
-
System Conditions
-
Lightly loaded induction motors
-
Over-excited synchronous machines
-
Long transmission lines (capacitive effect)
-
07
Motor Loading and Power Factor
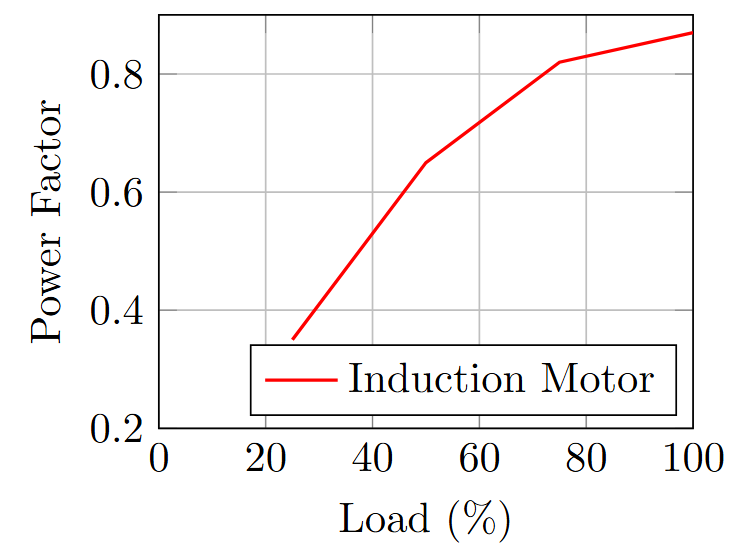
Key Observations:
-
Motors have poor PF at light loads
-
PF improves with loading
-
Oversized motors operate at poor PF
-
Proper motor sizing is crucial
Typical PF Values:
-
25% load: PF \(\approx\) 0.35
-
50% load: PF \(\approx\) 0.65
-
75% load: PF \(\approx\) 0.82
-
100% load: PF \(\approx\) 0.87
08
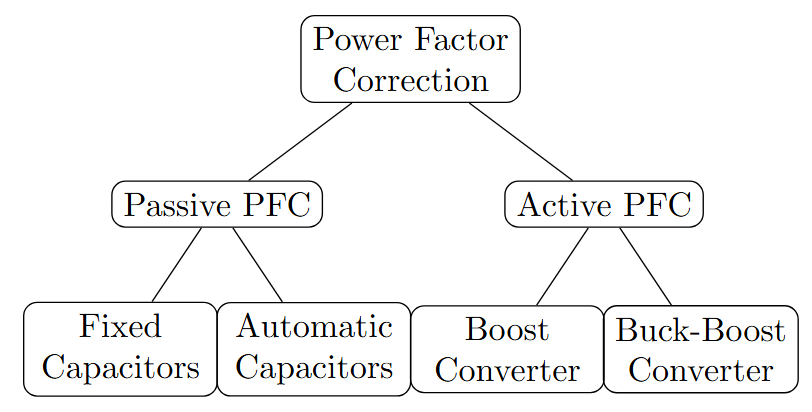
Classification of PFC Methods
-
Passive PFC: Uses reactive components (capacitors, inductors)
-
Active PFC: Uses power electronic circuits with control
09
Passive Power Factor Correction
Fixed Shunt Capacitors:
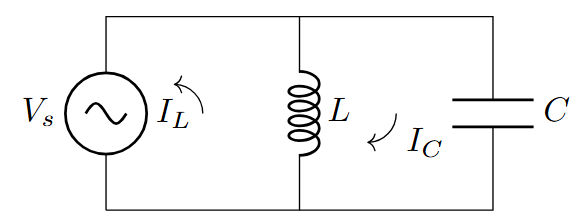
Principle:
-
Capacitor provides leading current
-
Compensates lagging inductive current
-
Net reactive power reduced
Capacitor Sizing:
\[Q_C = P(\tan\phi_1 - \tan\phi_2)\]
\[C = \frac{Q_C}{2\pi f V^2}\]
-
Advantages: Simple, low cost, maintenance-free
-
Disadvantages: Fixed compensation, may overcompensate at light loads
10
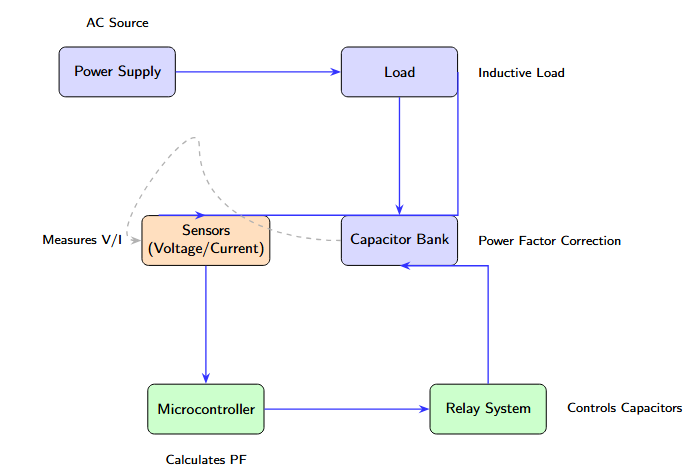
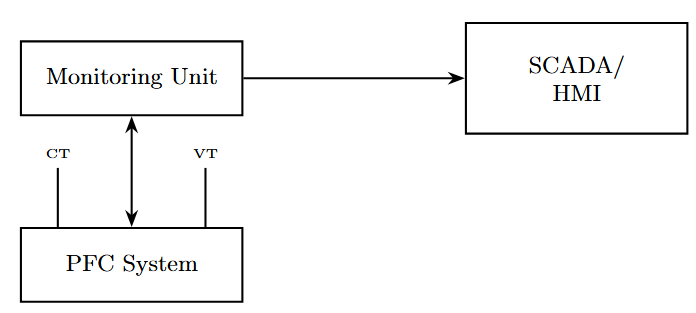
Automatic Power Factor Correction
Components:
-
PF controller/relay
-
Contactors for capacitor switching
-
Current transformers (CTs)
-
Voltage transformers (VTs)
-
Step-wise capacitor banks
Operation:
-
Continuous PF monitoring
-
Automatic capacitor switching
-
Maintains PF within set limits
11
Active Power Factor Correction
Boost Converter for PFC:
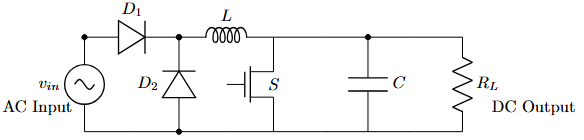
Operation:
-
Switch \(S\) controls inductor current
-
Current shaping to follow voltage
-
High-frequency switching (20-100 kHz)
-
Feedback control maintains output voltage
0.4 Advantages:
-
PF close to unity (0.99+)
-
Low harmonic distortion
-
Wide input voltage range
-
Voltage regulation capability
12
Active PFC Control Methods
-
Average Current Mode Control
-
Current loop shapes input current
-
Voltage loop regulates output voltage
-
Good dynamic response
-
-
Peak Current Mode Control
-
Simpler implementation
-
Faster transient response
-
Slope compensation may be required
-
-
Hysteresis Control
-
Variable frequency operation
-
Simple analog implementation
-
Good current tracking
-
-
Digital Control
-
Microcontroller/DSP based
-
Advanced algorithms possible
-
Adaptive control capabilities
-
13
Harmonics in Power Systems
Sources of Harmonics:
-
Non-linear loads (rectifiers, inverters, switching power supplies)
-
Magnetic saturation in transformers
-
Arc furnaces and welding equipment
Effects of Harmonics:
-
Increased RMS current
-
Additional losses in equipment
-
Interference with communication
-
Overheating of neutral conductors
-
Resonance problems with capacitors
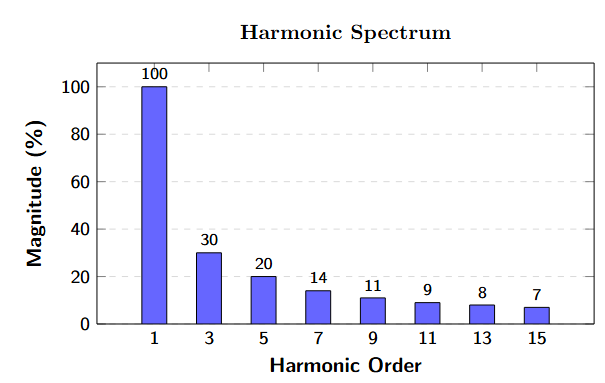
IEEE 519 Standard: Limits harmonic distortion (THD \(<\) 5% for voltage, variable for current based on system strength)
14
Power Factor vs. Displacement Power Factor
-
Displacement Power Factor (DPF): \(\cos\phi_1\) where \(\phi_1\) is fundamental phase angle
-
True Power Factor: Includes harmonic effects
\[PF = \frac{P}{S} = \frac{P_{total}}{V_{rms} \cdot I_{rms}}\] -
Relationship:
where \(THD_I\) is current total harmonic distortion\[PF = DPF \times \frac{1}{\sqrt{1 + THD_I^2}}\]
Example
For a load with DPF = 0.95 and \(THD_I\) = 30%:
\[PF = 0.95 \times \frac{1}{\sqrt{1 + 0.3^2}} = 0.95 \times 0.958 = 0.91\]
Important
Simply correcting displacement power factor may not improve true power factor if harmonics are present!
15
Capacitor Selection and Sizing
Step 1: Determine Required Reactive Power
\[Q_C = P \times (tan\phi_1 - tan\phi_2)\]
Step 2: Calculate Capacitor Value
\[C = \frac{Q_C \times 10^6}{2\pi f V_{LL}^2} \text{ (microfarads)}\]
| Initial PF | Target PF | kVAR per kW | Multiplier |
|---|---|---|---|
| 0.60 | 0.90 | 0.849 | 1.415 |
| 0.70 | 0.90 | 0.617 | 1.02 |
| 0.80 | 0.90 | 0.395 | 0.649 |
| 0.85 | 0.95 | 0.207 | 0.328 |
Step 3: Consider Practical Factors
-
Voltage rating (typically 1.1 × nominal)
-
Current rating (typically 1.35 × nominal due to harmonics)
-
Temperature derating
16
Protection and Safety Considerations
Essential Protection Elements:
-
Overcurrent Protection
-
Fuses or circuit breakers
-
Rating: 1.65-1.8 × capacitor current
-
-
Overvoltage Protection
-
Voltage monitoring relays
-
Automatic disconnection at 110% voltage
-
-
Switching Transients
-
Current-limiting reactors
-
Typically 5-7% reactance
-
Reduces inrush current and switching transients
-
-
Discharge Resistors
-
Discharge capacitors after switching off
-
Reduce voltage to 50V within 1 minute (NEC requirement)
-
17
Resonance and Harmonic Filtering
Series Resonance Problem:
-
Occurs when \(X_L = X_C\) at harmonic frequency
-
Can cause dangerous overvoltages and overcurrents
-
Resonant frequency: \(f_r = \frac{1}{2\pi\sqrt{LC}}\)
Solutions:
-
Detuned Reactors: 5.67% or 14% reactance
-
Harmonic Filters: Tuned to specific harmonics
-
Active Filters: Dynamic harmonic compensation
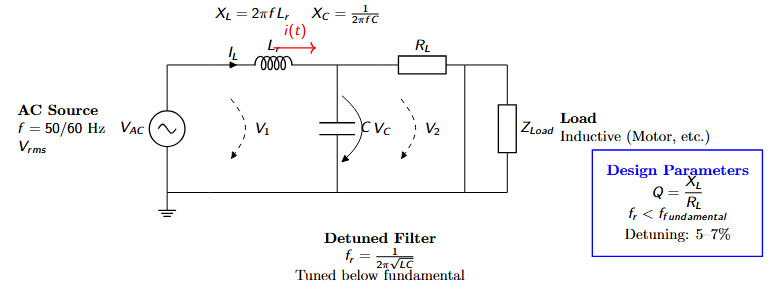
Filter Design Guidelines:
-
Tune below lowest significant harmonic (typically 4.7th harmonic)
-
Provide path for harmonic currents
-
Maintain power factor correction at fundamental frequency
18
Industrial Applications
-
Motor Drives and VFDs
-
Active PFC in drive front-end
-
Reduces harmonics and improves PF to\(>0.95\)
-
Compliance with IEEE 519 standards
-
-
Welding Equipment
-
High-power non-linear loads
-
Active PFC for power quality improvement
-
Flicker reduction in supply voltage
-
-
Induction Heating
-
High-frequency inverters require PFC
-
Resonant tank circuits with reactive power
-
Active PFC maintains constant DC bus voltage
-
| Application | Without PFC | With PFC | Improvement |
|---|---|---|---|
| VFD System | PF = 0.75 | PF = 0.98 | 31% current reduction |
| Welding Plant | PF = 0.65 | PF = 0.95 | 46% current reduction |
| Induction Heater | PF = 0.70 | PF = 0.99 | 41% current reduction |
19
Renewable Energy Applications
Solar PV Inverters:
-
Grid-tied inverters must maintain PF > 0.95
-
Reactive power support capability
-
Voltage regulation in weak grids
Wind Power Systems:
-
DFIG (Doubly Fed Induction Generator) systems
-
Grid-side converter provides PFC
-
Reactive power control for grid stability
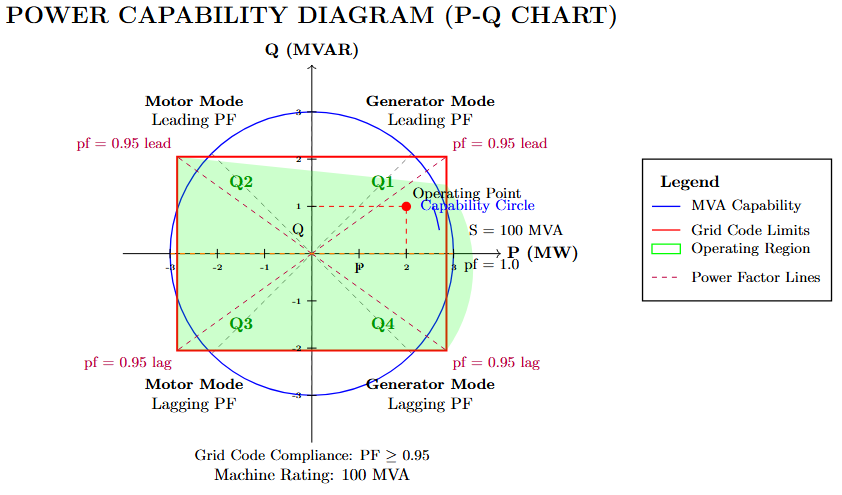
Grid Code Requirements:
-
Power factor range: 0.95 leading to 0.95 lagging
-
Voltage support during grid disturbances
-
Harmonic limits: THD < 5%
-
Reactive power capability: \(\pm 0.3 ~\text{p.u. }\)
20
Data Centers and IT Equipment
Challenges:
-
High concentration of switching power supplies
-
Significant harmonic generation
-
24/7 operation requirements
-
Efficiency and cooling concerns
PFC Solutions:
-
Server PSUs with integrated active PFC
-
Centralized active harmonic filters
-
UPS systems with input PFC
-
Power distribution units (PDUs) with monitoring
Case Study: Large Data Center
Before PFC: 2 MW load, PF = 0.75, THD = 25%
After PFC: Same load, PF = 0.98, THD = 3%
Results: 30% reduction in supply current, 40% reduction in cooling load
21
Multi-level Converters for PFC
Three-Level Vienna Rectifier:
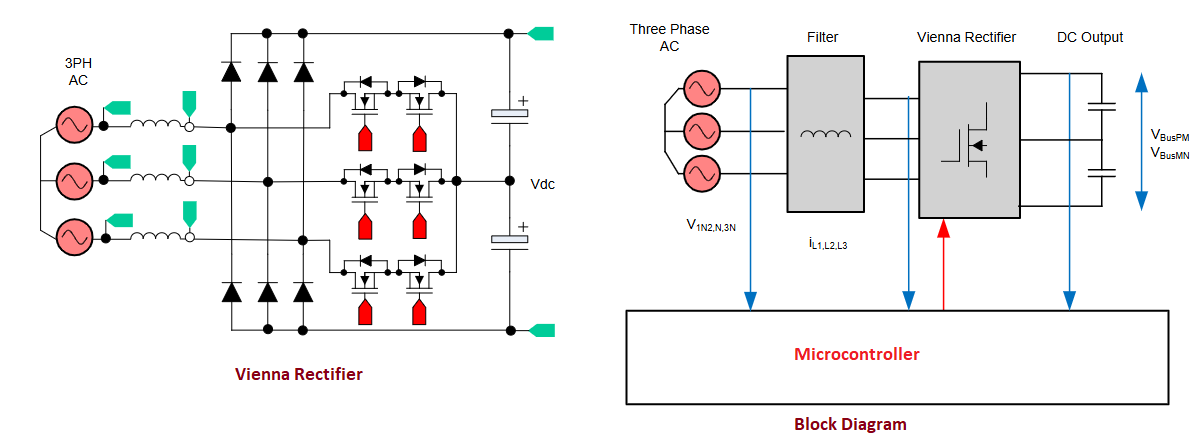
Advantages:
-
Reduced voltage stress on switches
-
Lower switching losses
-
Better harmonic performance
-
Suitable for high-power applications (>10 kW)
Applications:
-
Electric vehicle chargers
-
Large UPS systems
-
Industrial motor drives
22
Wide Bandgap Semiconductors
Silicon Carbide (SiC) and Gallium Nitride (GaN):
| Parameter | Silicon | SiC | GaN |
|---|---|---|---|
| Bandgap (eV) | 1.1 | 3.3 | 3.4 |
| Max Operating Temp (°C) | 150 | 200 | 200 |
| Switching Frequency | 20 kHz | 100 kHz | 500 kHz |
| Efficiency | 95% | 98% | 99% |
| Size/Weight | 100% | 50% | 30% |
Benefits for PFC:
-
Higher switching frequencies \(\to\) smaller magnetics
-
Lower conduction losses \(\to\) higher efficiency
-
Better thermal performance \(\to\) higher power density
-
Reduced cooling requirements
Challenges:
-
Higher cost (decreasing with volume)
-
Gate drive complexity
-
EMI considerations at high frequencies
23
Digital Control and Smart PFC
Digital Control Advantages:
-
Adaptive algorithms for varying load conditions
-
Communication interfaces (Modbus, Ethernet)
-
Advanced protection and diagnostics
-
Predictive maintenance capabilities
Smart PFC Features:
-
Real-time monitoring
-
Remote control and monitoring
-
Data logging and analytics
-
Integration with building management systems
-
Machine learning for optimization
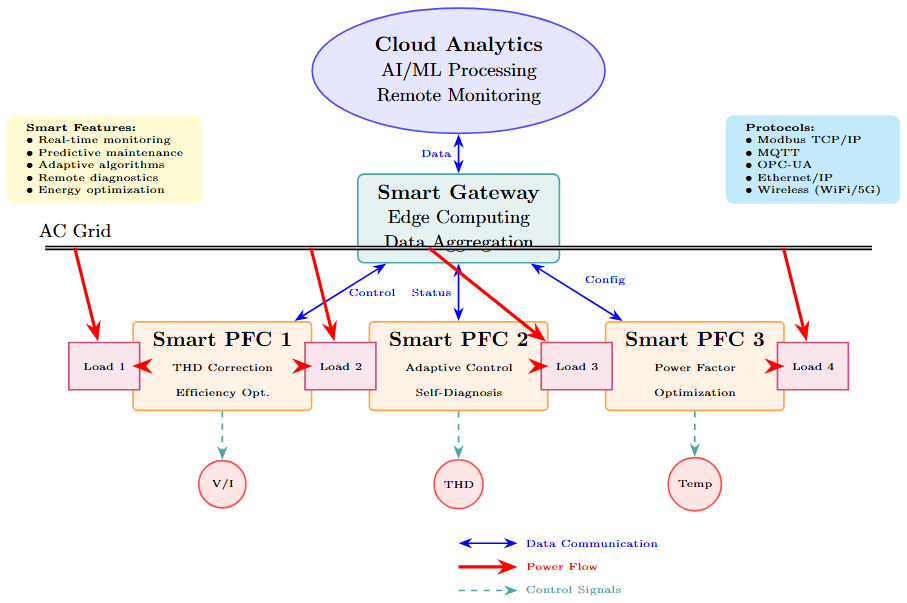
IoT Integration:
-
Wireless communication protocols
-
Edge computing for local optimization
-
Centralized energy management
24
Grid Integration and Vehicle-to-Grid
Bidirectional PFC for V2G:
-
Electric vehicles as mobile energy storage
-
Bidirectional power flow capability
-
Grid support services (frequency regulation, peak shaving)
-
Reactive power compensation
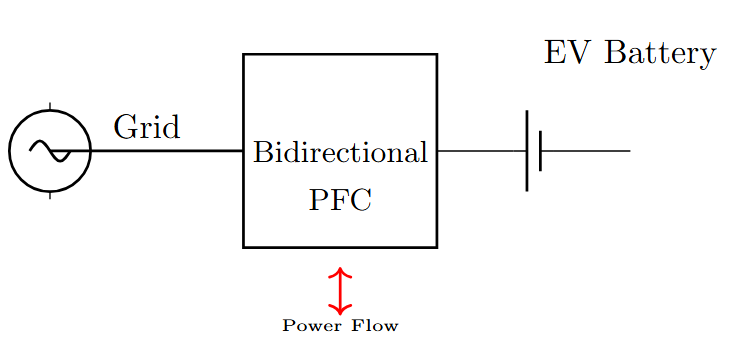
Technical Requirements:
-
Unity power factor in both directions
-
Fast dynamic response (\(< 100~\text{ms}\))
-
Isolation for safety
-
Communication protocols (ISO 15118)
25
Key International Standards
| Standard | Scope |
|---|---|
| IEEE 519 | Harmonic limits in power systems |
| IEC 61000-3-2 | Harmonic current limits for equipment \(\leq 16 ~\mathrm{A}\) |
| IEC 61000-3-4 | Harmonic current limits for equipment \(>16~\mathrm{A}\) |
| IEC 61000-3-12 | Current limits for equipment 16-75A |
| EN 50160 | Power quality characteristics |
| IEEE 1547 | Interconnection of distributed resources |
| UL 508C | Power conversion equipment safety |
Compliance Requirements:
-
Harmonic Limits: THD \(< 5\%\) (voltage), variable (current)
-
Power Factor: Typically \(> 0.9\) for industrial loads
-
Flicker: Voltage fluctuation limits
-
EMC: Electromagnetic compatibility requirements
26
Regional Regulations
European Union:
-
CE marking mandatory for PFC equipment
-
ErP (Energy-related Products) Directive
-
Minimum efficiency requirements
United States:
-
ENERGY STAR certification programs
-
FCC Part 15 for EMI compliance
-
NEC (National Electrical Code) installation requirements
India:
-
BIS (Bureau of Indian Standards) certification
-
Central Electricity Authority regulations
-
State-specific power factor requirements
Penalty Structures
Many utilities impose penalties for PF \(< 0.85-0.9\):
-
India: \(2\%\) per 0.01 below \(0.85\)
-
US: Varies by utility, typically\(0.5-1.5\%\)
-
EU: Market-based penalties in deregulated markets
27
Cost-Benefit Analysis
Initial Investment Costs:
-
Capacitor banks: $50-100/kVAR
-
Automatic PFC panels: $150-300/kVAR
-
Active PFC systems: $300-500/kVAR
-
Installation and commissioning: 15-25% of equipment cost
Operating Savings:
-
Reduced electricity bills (penalty avoidance)
-
Lower maximum demand charges
-
Reduced transmission losses
-
Extended equipment life
ROI Calculation Example
Industrial Plant: 1 MW load, PF = 0.7 \(\to\) 0.95
Investment: $50,000 (capacitor bank system)
Annual Savings: $18,000 (penalty avoidance + demand reduction)
Payback Period: 2.8 years
10-year NPV: $95,000 (assuming 8% discount rate)
28
Sensitivity Analysis
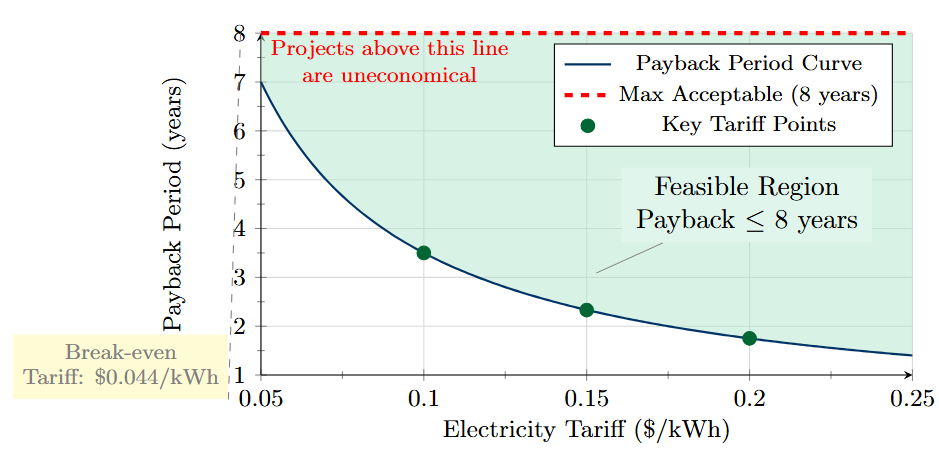
Key Factors Affecting ROI:
-
Electricity tariff rates
-
Penalty structure severity
-
Load factor and operating hours
-
Interest rates and financing
-
Equipment reliability and maintenance
Risk Factors:
-
Technology obsolescence
-
Regulatory changes
-
Load pattern changes
-
Utility tariff restructuring
29
Common Problems and Solutions
| Problem | Possible Cause | Solution |
|---|---|---|
| Capacitor overheating | Overvoltage, harmonics | Check voltage, add reactors |
| Nuisance tripping | Switching transients | Install pre-insertion resistors |
| Poor PF improvement | Wrong sizing, harmonics | Recalculate, add filters |
| Voltage fluctuations | Capacitor switching | Use staged switching |
| High maintenance | Poor environment | Improve ventilation, cleaning |
Diagnostic Tools:
-
Power quality analyzers
-
Harmonic analyzers
-
Thermal imaging cameras
-
Capacitor testers
-
Oscilloscopes for transient analysis
Preventive Maintenance Schedule:
-
Monthly: Visual inspection, temperature monitoring
-
Quarterly: Electrical measurements, contact inspection
-
Annually: Capacitor testing, protective relay testing
30
Monitoring and Diagnostics
Key Parameters to Monitor:
-
Power factor (displacement and true)
-
Harmonic distortion (THD)
-
Capacitor current and voltage
-
Temperature rise
-
Switching frequency (for active PFC)
Advanced Diagnostics:
-
Partial discharge monitoring
-
Insulation resistance testing
-
Capacitance drift monitoring
-
Thermal signature analysis
-
Vibration analysis
Predictive Maintenance Benefits:
-
Reduced unplanned downtime
-
Extended equipment life
-
Optimized maintenance costs
-
Improved system reliability
31
Case Study 1: Manufacturing Plant
Background:
-
500 kW textile manufacturing plant
-
Multiple induction motors and lighting loads
-
Initial PF = 0.68, penalty charges = $2,000/month
Solution Implementation:
-
Installed 300 kVAR automatic capacitor bank
-
Added 5.67% detuning reactors for harmonic protection
-
Implemented power factor controller with 6 steps
Results:
| Parameter | Before | After |
|---|---|---|
| Power Factor | 0.68 | 0.96 |
| Supply Current | 1,330 A | 945 A |
| Monthly Penalty | $2,000 | $0 |
| Energy Savings | - | 12% |
Financial Impact:
-
Investment: $45,000
-
Annual savings: $28,800
-
Payback: 1.6 years
-
10-year NPV: $175,000
32
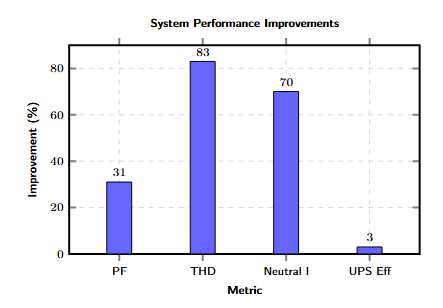
Case Study 2: Data Center PFC
Challenge:
-
2 MW data center with high harmonic content
-
Server PSUs creating 15-20% THD
-
Neutral conductor overheating issues
Solution:
-
Centralized active harmonic filter (500 kVAR)
-
Individual server PSUs upgraded to active PFC
-
Real-time monitoring system implemented
Technical Results:
-
THD reduced from 18% to 3%
-
Power factor improved from 0.75 to 0.98
-
Neutral current reduced by 70%
-
UPS efficiency improved by 3%
33
Emerging Technologies
Next-Generation Power Electronics:
-
Ultra-wide bandgap materials (Diamond, AlN)
-
Matrix converters for direct AC-AC conversion
-
Modular multilevel converters (MMC)
-
Solid-state transformers with integrated PFC
AI and Machine Learning Integration:
-
Predictive load forecasting
-
Adaptive control algorithms
-
Anomaly detection and fault prediction
-
Optimal scheduling for reactive power dispatch
Grid Modernization Impact:
-
Smart grid integration
-
Distributed energy resources coordination
-
Real-time pricing and demand response
-
Vehicle-to-grid (V2G) integration
-
Microgrids and energy communities
34
Market Trends and Drivers
Market Growth Drivers:
-
Increasing energy costs and carbon pricing
-
Stricter power quality regulations
-
Growing renewable energy integration
-
Electrification of transportation
-
Industrial automation and digitalization
Technology Roadmap:
-
2025: Wide bandgap mainstream
-
2027: AI-optimized PFC systems
-
2030: Integrated energy management
-
2035: Quantum-enhanced control
35
Key Takeaways
-
Power factor correction is essential for efficient and economical power system operation
-
Multiple technologies available:
-
Passive PFC: Simple, cost-effective for steady loads
-
Active PFC: Superior performance for dynamic/non-linear loads
-
-
Proper design considerations:
-
Load analysis and sizing
-
Harmonic mitigation
-
Protection and safety
-
-
Economic benefits are significant:
-
Typical payback: 1-3 years
-
Ongoing operational savings
-
Improved system capacity
-
-
Future is digital and intelligent:
-
Smart monitoring and control
-
Integration with energy management
-
Adaptive optimization algorithms
-
36
Summary and Best Practices
Design Best Practices:
-
Conduct thorough load analysis before PFC selection
-
Consider harmonic content and use appropriate filtering
-
Implement proper protection and monitoring
-
Plan for future load growth and changes
-
Ensure compliance with applicable standards
Implementation Guidelines:
-
Start with power quality audit
-
Calculate economic justification
-
Select appropriate PFC technology
-
Proper installation and commissioning
-
Establish maintenance procedures
Final Recommendation
Power factor correction is not just about avoiding penalties - it’s about creating a more efficient, reliable, and sustainable electrical system that benefits everyone from utilities to end users.