Introduction
This experiment converts three-phase AC to DC using a six-diode bridge rectifier. The three-phase topology produces a 300 Hz output ripple (vs. 100 Hz for single-phase), yielding lower ripple factor and superior load performance.
Three-phase rectifiers produce \(V_{dc} = 2.34 \cdot V_{phase,rms}\), with a ripple factor of only 0.042 — far superior to single-phase rectifiers.
Theory
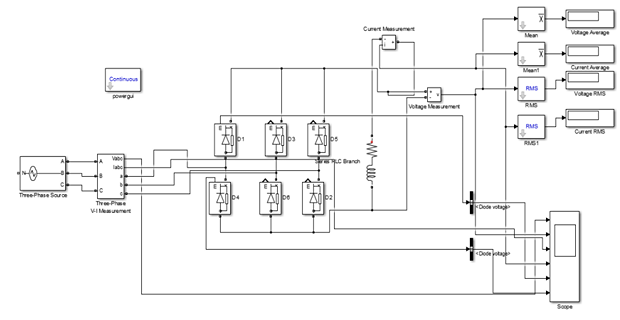
The three-phase bridge consists of six diodes in two groups: D1, D3, D5 in the positive group and D2, D4, D6 in the negative group. At any instant, one diode from each group conducts. The output voltage follows the highest line-to-line voltage, producing a six-pulse waveform per cycle.

Simulation — R and RL Loads
(a) Implement the 3-phase uncontrolled full-wave rectifier with R = 100 Ω. Input: \(V_{LL,rms} = 61.2\text{ V}\), 50 Hz.
(b) Add L = 6 mH in series with R. Observe changes in waveform and FFT analysis.
Calculation:
- Form Factor \(= V_{rms}/V_{dc}\)
- Ripple Factor \(= \sqrt{\text{FF}^2 - 1}\)
- FFT fundamental at 300 Hz (6th harmonic of 50 Hz)
Expected improvement over 1φ:
- Lower ripple factor (~0.042 vs ~0.482)
- Higher mean output voltage
- Continuous load current even for moderate L values
Hardware Implementation
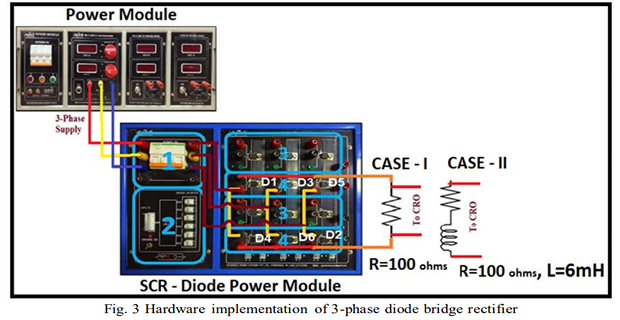
Procedure — R Load (Case 1)
- Connect circuit as in Fig. 3 (R = 100 Ω). Switch ON 3φ supply MCB.
- Switch ON POWER MODULE and SCR–Diode module MCBs. Increase to 61.2 V RMS.
- Connect CRO probes across R load. Observe output voltage and FFT plot (fundamental at 300 Hz).
Procedure — RL Load (Case 2)
- Add L = 6 mH in series with R = 100 Ω. Connect CRO probes across RL load.
- Observe and compare the smoother current waveform with the R-load case.
Results
Required waveforms: Output Voltage, Output Current, Input Line Voltages, Input Line Currents, Diode voltages (D1 and D4), FFT lists — all in Simulink.
Performance Parameters
| Parameter | R Load — Sim | R Load — HW | RL Load — Sim | RL Load — HW |
|---|---|---|---|---|
| VRMS (V) | ||||
| IRMS (A) | ||||
| VAVG (V) | ||||
| IAVG (A) | ||||
| Form Factor | ||||
| Ripple Factor | ||||
| THD (%) | ||||
| Vfundamental (RMS) | ||||
| V 2nd Harmonic | ||||
| V 3rd Harmonic |