Introduction to Vacuum Systems
-
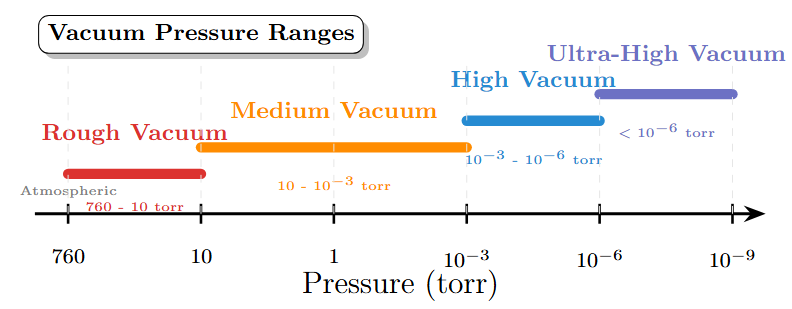
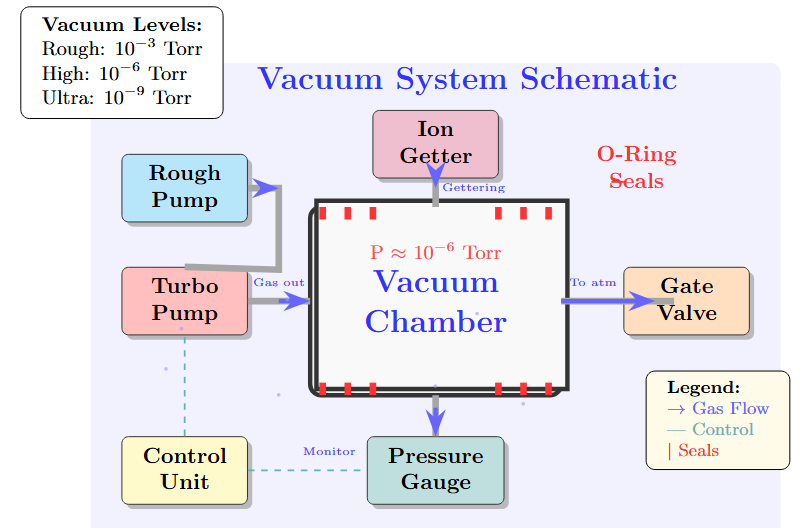
A vacuum system maintains pressure below atmospheric pressure, measured in mm of mercury (torr).
-
Standard atmospheric pressure at \(0^{\circ}~\mathrm{C} = 760~\text{mm of Hg}\).
-
\( 1 \, \text{torr} = 1 \, \text{mm Hg}; \, 1 \times 10^{-3} \, \text{torr} = 1 \, \text{micron} \)
-
Modern systems achieve pressures as low as \( 1 \times 10^{-8} \, \text{torr} \).
-
Applications: Vacuum interrupters, particle accelerators, and high-voltage insulation systems.
-
Design challenges: Maintaining ultra-high vacuum against outgassing and leaks.
-
Different vacuum levels have distinct characteristics.
-
High and ultra-high vacuum required for electrical applications.
-
Roughing vacuum: Initial pump-down stage.
-
Molecular flow regime: Pressure \(< 10^{-3}\) torr.
-
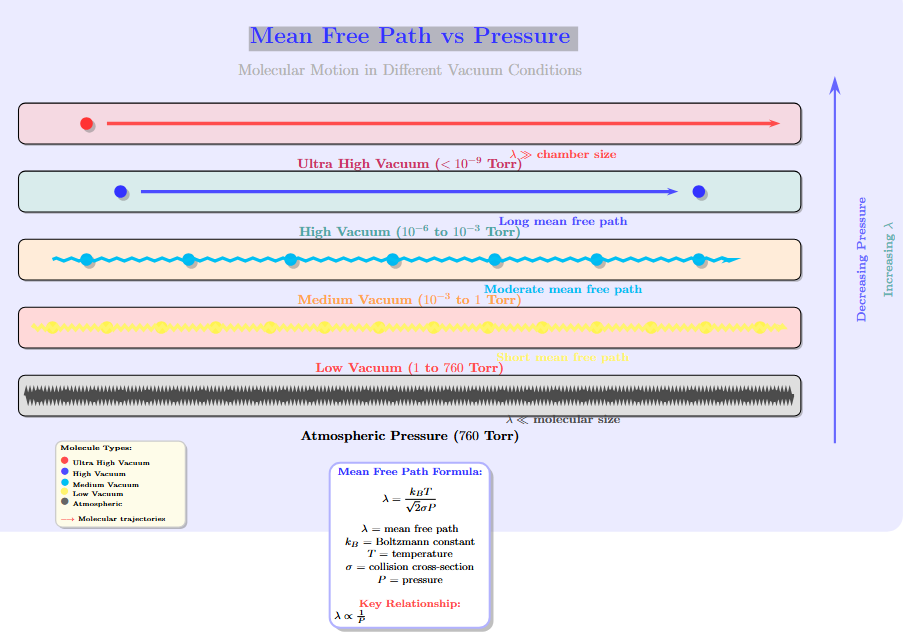
Mean free path formula:
where \(n\) is molecular density and \(\sigma\) is collision cross-section.\[\lambda = \frac{1}{\sqrt{2} \times n \times \sigma}\] -
Molecular density varies with vacuum level:
Vacuum Level Pressure (torr) Molecules/cm³ Atmospheric 760 \(2.7 \times 10^{19}\) High Vacuum \(10^{-6}\) \(3.5 \times 10^{10}\) Ultra-High Vacuum \(10^{-9}\) \(3.5 \times 10^{7}\) -
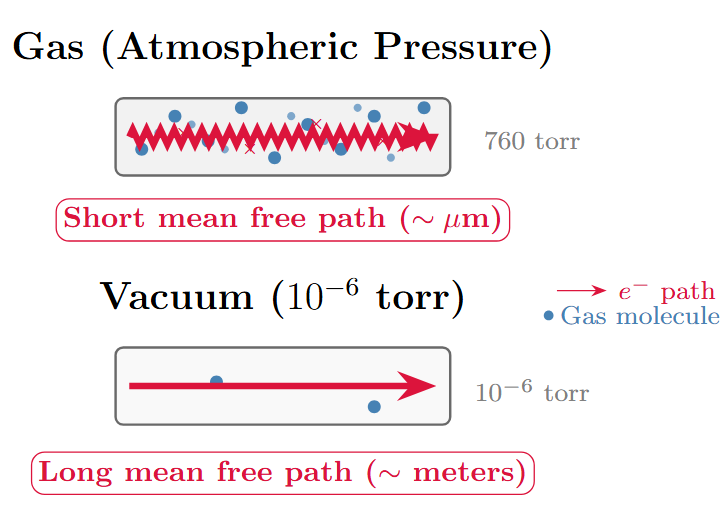
At \(10^{-6}\) torr, mean free path \(\approx\) 50 meters.
-
Relationship: \(n = \frac{P}{k_B T}\) (ideal gas law).
-
Knudsen number: \(Kn = \lambda/L\) determines flow regime.
Townsend Discharge in Gas vs. Vacuum
-
In gas, short mean free path leads to electron avalanches via ionization:
\[I = I_0 e^{\alpha d}, \quad \text{where } \alpha \text{ is ionization coefficient.}\] -
In vacuum (\( 1 \times 10^{-5} \, \text{torr} \)), mean free path is several meters.
-
For small gaps (few mm), electrons cross without collisions, preventing avalanche formation.
-
Gas liberation in vacuum (e.g., from electrode surfaces) enables Townsend-like discharge.
-
Implication: Vacuum insulation design must account for residual gas effects.
-
Critical parameter: \(\alpha d < 1\) for vacuum conditions.
-
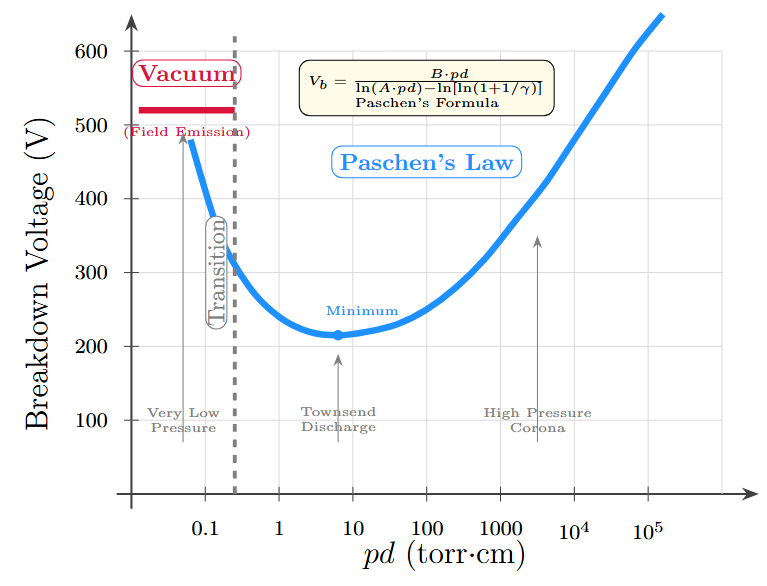
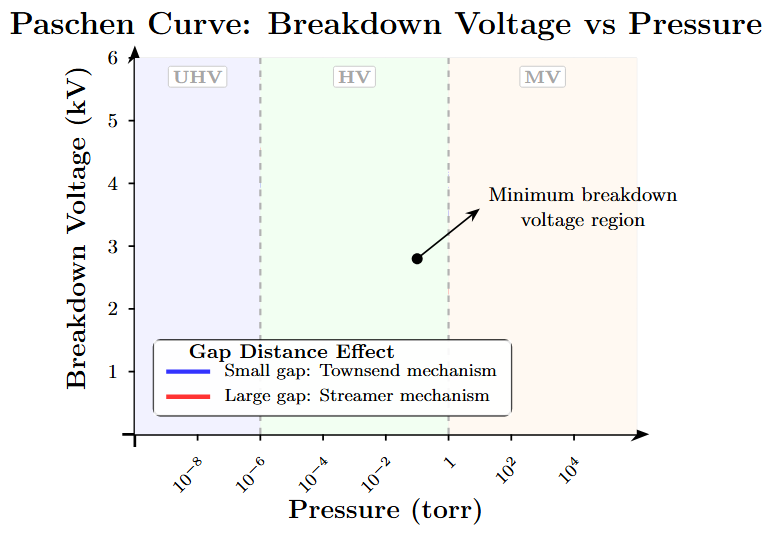
Paschen’s law fails at \(pd < 10^{-2}\) torr·cm.
-
Transition from gas discharge to field emission dominated breakdown.
-
Critical pressure: \(P_c \approx \frac{1}{d \times 10^2}\) torr (for gap \(d\) in cm).
-
Left branch of Paschen curve: Field emission regime.
-
Gas discharge regime (\(pd > 1\) torr·cm):
-
Townsend avalanche multiplication
-
Secondary emission coefficient \(\gamma\) important
-
Breakdown condition: \(\gamma(\exp(\alpha d) - 1) = 1\)
-
-
Intermediate regime (\(10^{-2} < pd < 1\) torr·cm):
-
Mixed mechanisms: collision and field emission
-
Statistical time lag becomes significant
-
Voltage-dependent breakdown probability
-
-
Vacuum regime (\(pd < 10^{-2}\) torr·cm):
-
Field emission dominated
-
Electrode surface conditions critical
-
Micro-projection enhancement effects
-
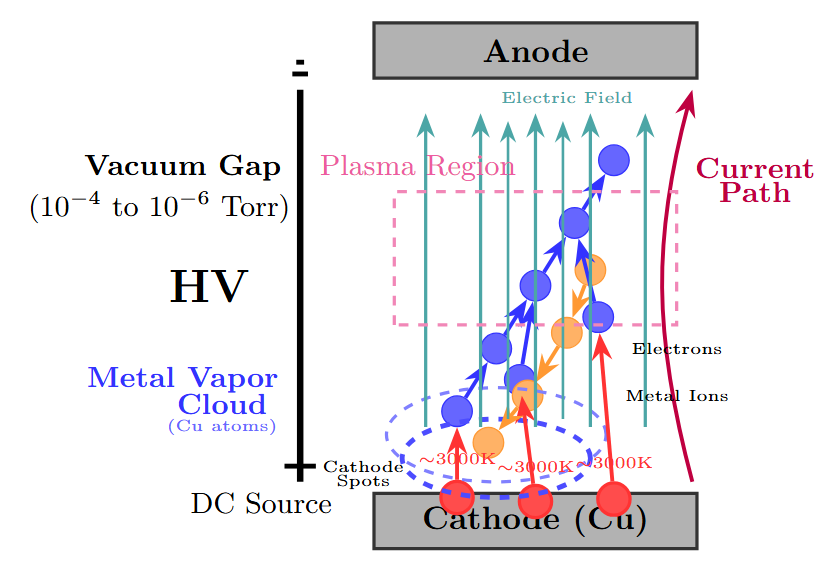
Vacuum Arc
-
Neutral atoms, ions, and electrons originate from electrodes via evaporation.
-
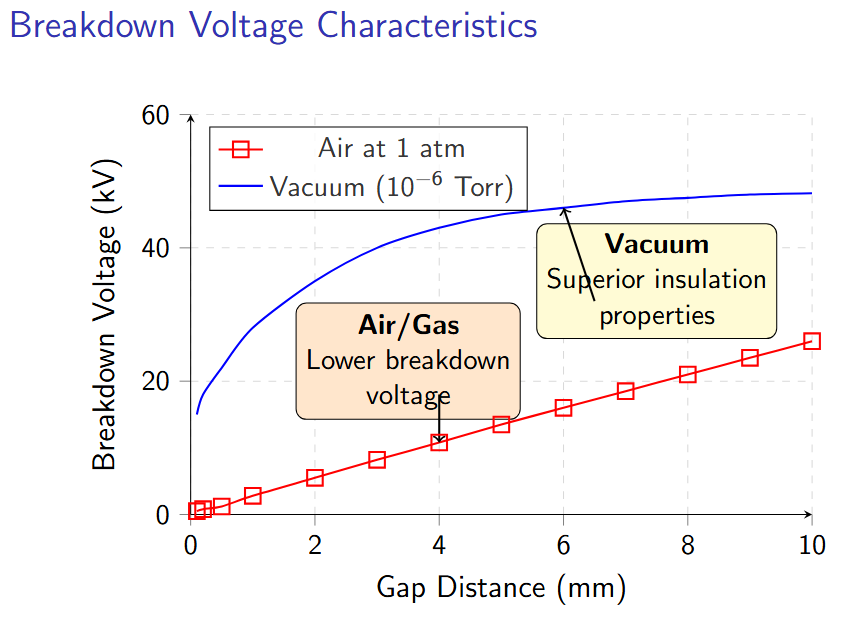
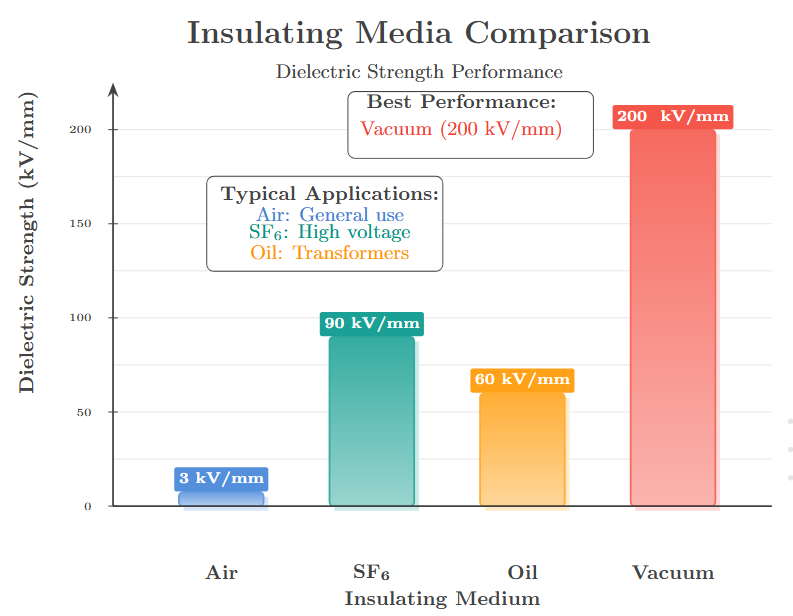
Large mean free path results in dielectric strength 1000x higher than gas due to minimal ionization.
-
Breakdown strength depends on gap length and electrode surface condition.
-
Polished, degassed electrodes increase breakdown strength.
-
Roughened electrodes reduce strength; improved by high-voltage impulses.
-
Optimal gap for metals (e.g., Ag, Bi-Cu) is \( < 3 \, \text{mm} \) at \( 1 \times 10^{-6} \, \text{torr} \).
-
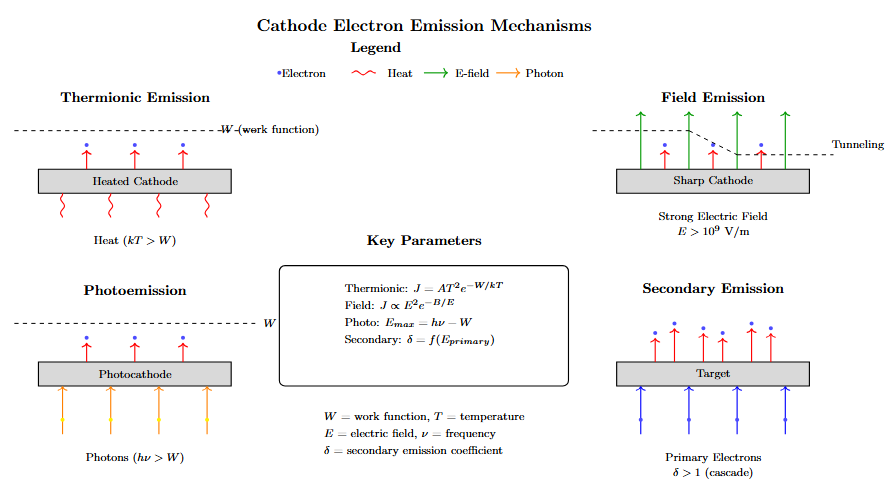
Fowler-Nordheim equation describes field emission current density:
where \(A = 1.54 \times 10^{-6}\) A·eV·V\(^{-2}\), \(B = 6.83 \times 10^7\) eV\(^{-3/2}\)·V·cm\(^{-1}\)\[J = \frac{A \times E^2}{\phi} \times \exp\left(-\frac{B \times \phi^{3/2}}{E}\right)\] -
Work function values for electrode materials:
Material Work Function (eV) Copper (Cu) 4.7 Silver (Ag) 4.3 Tungsten (W) 4.5 Bismuth (Bi) 4.2 -
Temperature dependence: \(J \propto T^2 \exp(-\phi/k_B T)\) for thermionic emission.
-
Field enhancement factor \(\beta\) at micro-projections: \(E_{local} = \beta \times E_{average}\).
-
Field enhancement at micro-projections:
where \(h\) is projection height and \(r\) is tip radius.\[\beta = \frac{h}{r} \quad \text{(height-to-radius ratio)}\] -
Critical field for emission: \(E_c \approx 10^7\) V/cm for most metals.
-
Surface roughness effects:
-
Polished surface: \( R_a < 0.1 \, \mu\text{m} \)
-
Rough surface: \( R_a > 1 \, \mu\text{m} \)
-
Field enhancement: \(\beta = 10-100\) for rough surfaces
-
-
Schottky effect: Image force reduces effective work function:
\[\phi_{eff} = \phi - \sqrt{\frac{eE}{4\pi\epsilon_0}}\] -
Surface preparation crucial for reliable operation.
-
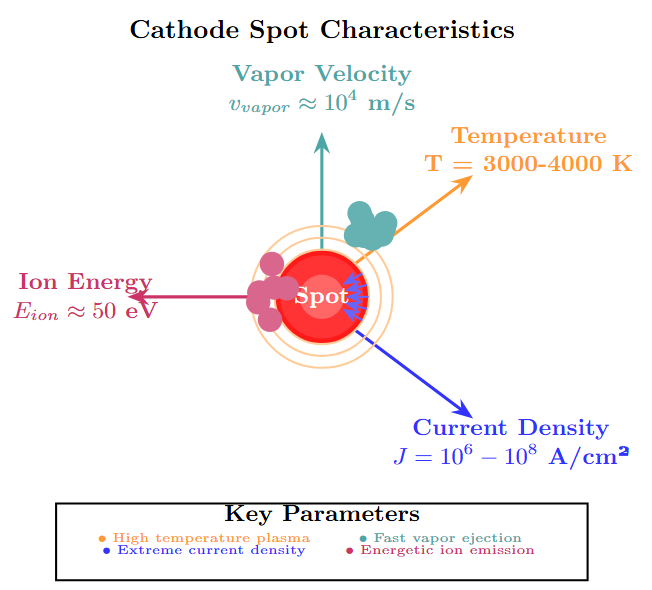
Cathode spot diameter: \( 1 \, \mu\text{m} \) to \( 100 \, \mu\text{m} \).
-
Erosion rate: \( 50 \, \mu\text{g} \, \text{C}^{-1} \) for copper.
-
Plasma density: \(10^{18} - 10^{19}\) particles/cm³.
-
Current density: \(10^8 - 10^9\) A/cm² at cathode spots.
-
Temperature: 3000-4000 K at active spots.
Electric Discharge in Vacuum
-
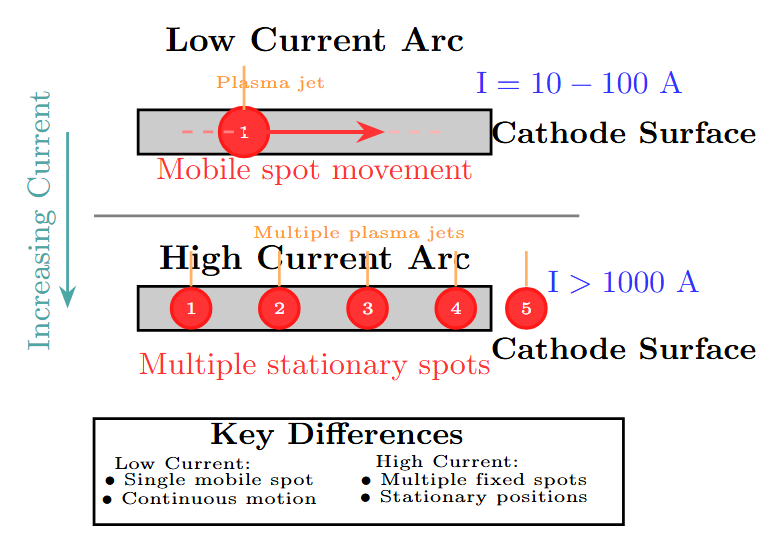
Cathode spots form based on current:
Current Level Cathode Spot Behavior Low Current (\(< 100 ~\mathrm{A}\)) Single mobile spot High Current (\(> 1000 ~\mathrm{A}\)) Multiple stationary spots -
Spots are primary vapor sources for the arc.
-
Discharge triggered by high electric fields or resistive heating at micro-projections.
-
Cold cathode discharge: emission from spots, not entire cathode surface.
-
Typical currents in vacuum interrupters: 100 A to 10 kA.
-
Anode modes depend on current density:
Current Density Anode Mode Characteristics < \(10^3\) A/cm² Diffuse Low voltage drop \(10^3 - 10^5\) A/cm² Intermediate Transition mode > \(10^5\) A/cm² Constricted High voltage drop -
Anode heating: Joule heating + ion bombardment + radiation.
-
Anode fall voltage: 10-20 V in diffuse mode, 50-100 V in constricted mode.
-
Metal vapor generation: Both cathode and anode contribute.
-
Retrograde motion: Cathode spots move against \(\vec{J} \times \vec{B}\) force.
-
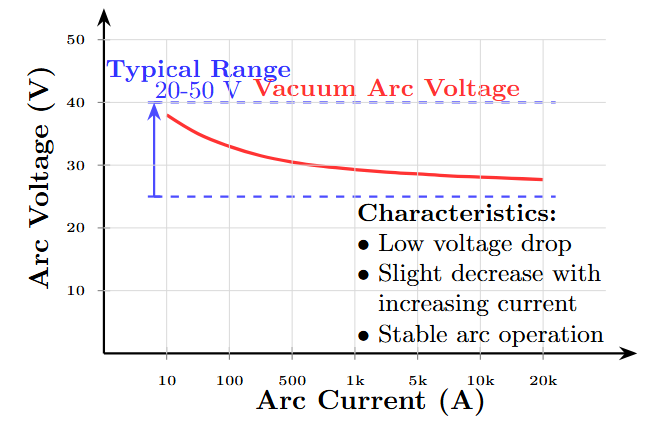
Typical arc voltage: 20-50 V (nearly constant).
-
Number of cathode spots: \(N \approx I/I_0\) where \(I_0 \approx\) 100 A per spot.
-
Energy balance: Joule heating = evaporation + radiation + conduction.
-
Power density at cathode: \(10^8 - 10^9~\mathrm{W/cm^2}\) .
-
Multiple emission mechanisms operate simultaneously.
-
Field emission dominates at high electric fields.
-
Secondary emission sustains the discharge.
-
Explosive electron emission at very high current densities.
-
Depends on contact material (vapor pressure) and circuit parameters (voltage, current, inductance, capacitance).
-
High vapor pressure at low temperature (e.g., Zn, Bi) enhances stability.
-
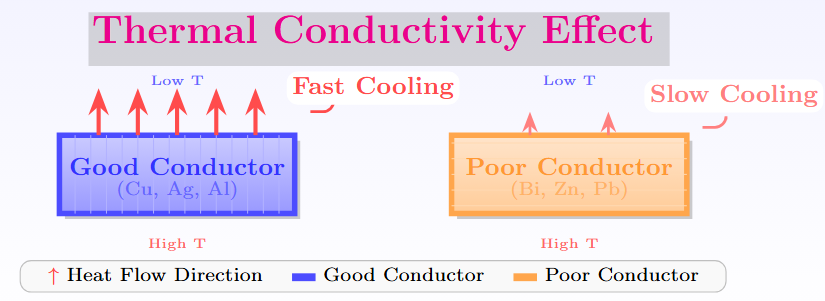
Thermal conductivity affects current chopping:
-
Good conductors cool faster, reducing vapor, leading to arc chopping.
-
Poor conductors maintain vaporization, stabilizing the arc.
-
-
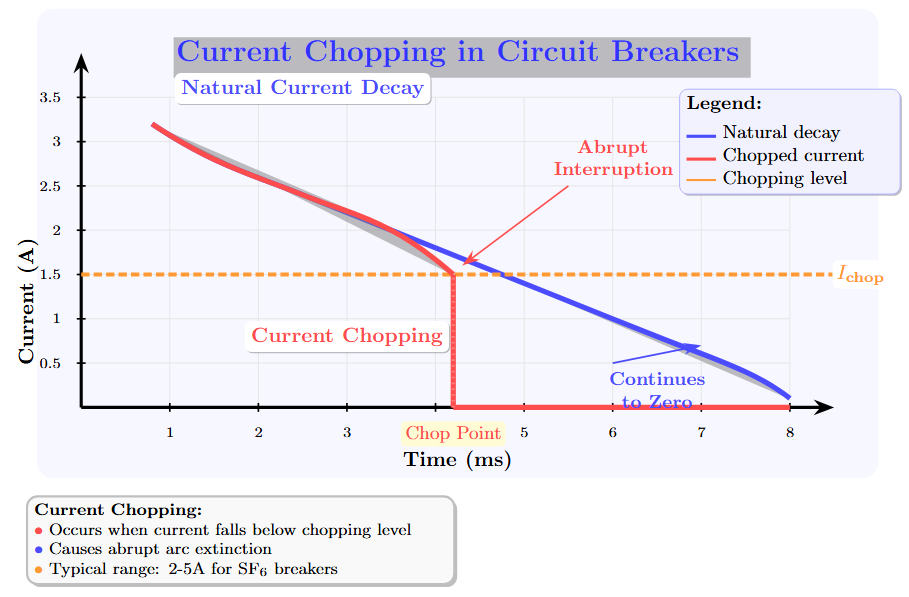
Current chopping levels for different materials:
Material Chopping Level (A) Copper (Cu) 2-5 Silver (Ag) 3-8 Bismuth (Bi) 0.5-2 Cu-Bi alloy 1-3 -
Overvoltage: \(V = L \frac{di}{dt}\) can reach several kV.
-
Impact: Affects TRV (Transient Recovery Voltage) in circuit breakers.
Non-metallic Electron Emission
-
Pre-breakdown current originates from non-metallic surfaces (e.g., oxides, organic residues).
-
Micro-inclusions (e.g., trapped gas pockets) reduce breakdown strength.
-
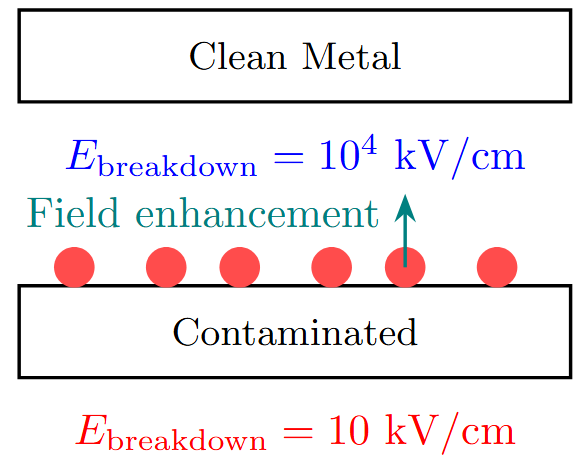
Contamination (e.g., Na, K, B, Al, Si) from glass sealing, fingerprints, or pump oil deposits on electrodes.
-
Contaminants enhance:
-
Field emission
-
Secondary electron emission
-
Stimulated desorption of molecules/ions
-
-
Reduces electric strength to \( 10 \, \text{kV} \, \text{cm}^{-1} \) (vs. \( 1 \times 10^4 \, \text{kV} \, \text{cm}^{-1} \) for pure field emission).
-
Electron stimulated desorption (ESD):
-
Electrons impact surface → gas molecules released
-
Desorption yield: \(\eta = 10^{-4} - 10^{-2}\) molecules/electron
-
Common desorbed gases: \(H_2\), \(H_2O\), \(CO\), \(CO_2\)
-
-
Ion stimulated desorption (ISD):
-
Higher desorption yield than ESD
-
Physical sputtering + chemical desorption
-
-
Virtual leaks:
-
Trapped volumes in threads, welds, porous materials
-
Slow outgassing affects vacuum level
-
Solution: Proper venting and design
-
-
Permeation: Hydrogen through metal walls at elevated temperatures.
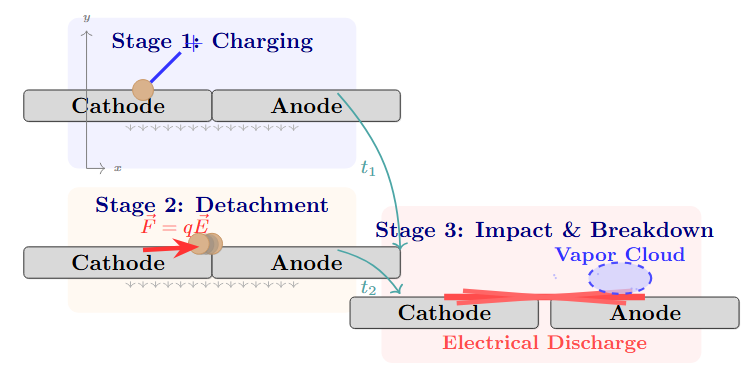
Clump Mechanism
-
Assumes a loosely bound particle (clump, \( 1 \, \mu\text{m} \) to \( 100 \, \mu\text{m} \)) on electrode surface.
-
Steps:
-
Clump charges under high voltage.
-
Detaches and is attracted to opposite electrode.
-
Impact releases vapor/gas, triggering discharge.
-
-
Frequent breakdowns increase withstand voltage via electrode conditioning.
-
Practical implication: Critical for reliable operation of vacuum interrupters in circuit breakers.
-
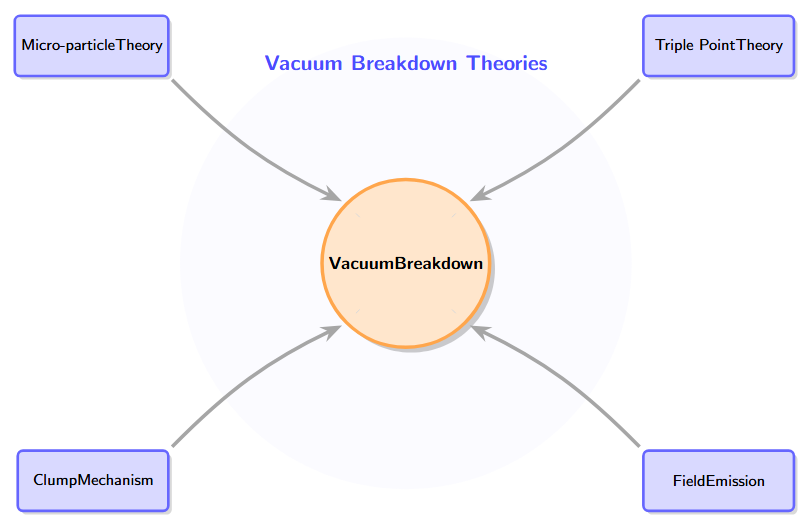
Micro-particle theory: Conducting particles in vacuum gap initiate breakdown.
-
Triple point theory: Breakdown at electrode-insulator-vacuum junction due to field enhancement.
-
Statistical nature: Breakdown follows Weibull distribution:
where \(n\) is shape parameter (typically 5-15) and \(V_0\) is scale parameter.\[P(V) = 1 - \exp\left[-\left(\frac{V}{V_0}\right)^n\right]\]
-
Statistical time lag (\(t_s\)):
-
Time required for initiating electron to appear
-
Follows Poisson distribution: \(P(t) = 1 - \exp(-t/t_s)\)
-
Typically: \(t_s = 10^{-6} - 10^{-3}\) seconds
-
-
Formative time lag (\(t_f\)):
-
Time for discharge development after initiation
-
Generally: \(t_f = 10^{-8} - 10^{-6}\) seconds
-
Depends on gap length and applied voltage
-
-
Area effect: Breakdown voltage decreases with electrode area:
\[V_b = V_0 \times A^{-n}, \quad n = 0.1-0.3\] -
Electrode material influence: Work function, thermal properties, surface roughness.
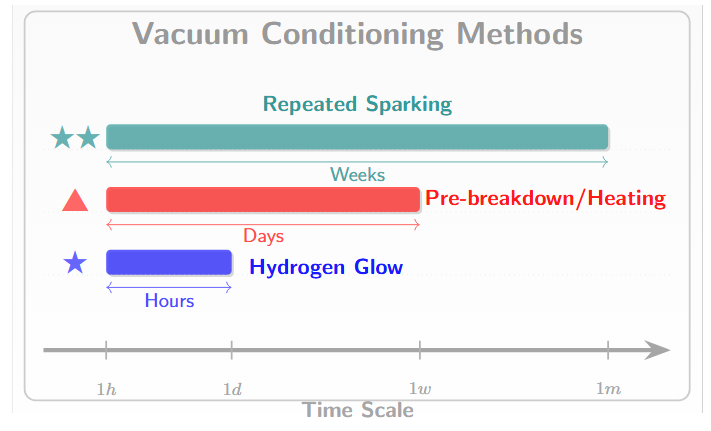
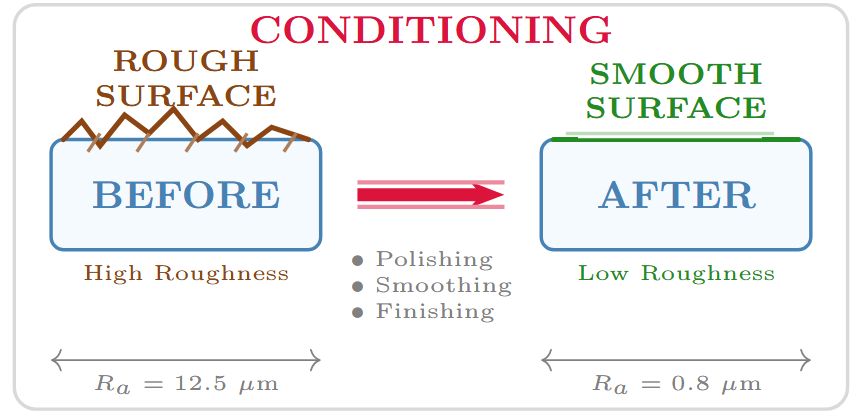
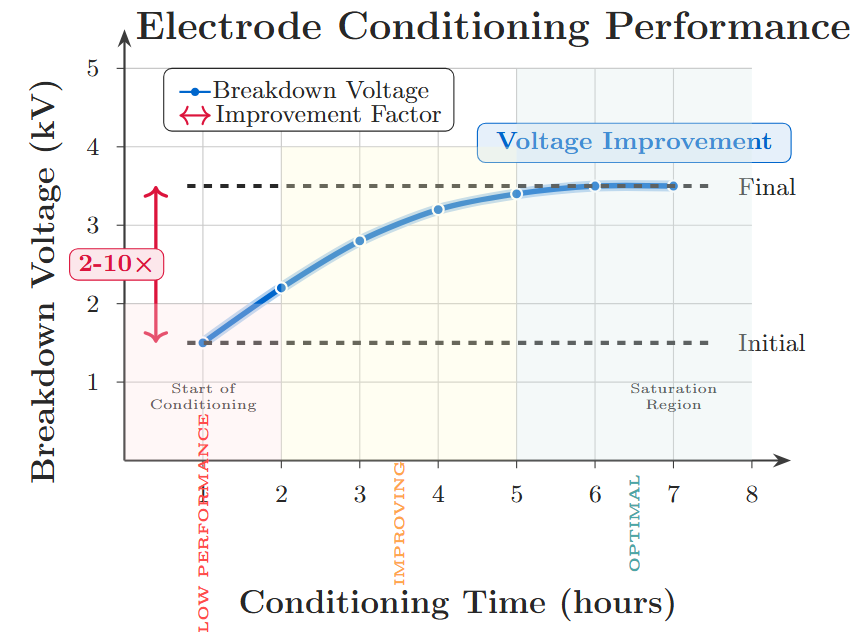
Electrode Conditioning
-
Destroys micro-emission sites, increasing withstand voltage.
-
Methods:
-
Hydrogen glow discharge (consistent results, typically hours).
-
Pre-breakdown current flow or high-temperature heating in vacuum (days for large systems).
-
Repeated spark breakdowns (time-consuming, weeks for unpolished electrodes).
-
-
Larger electrode area reduces breakdown voltage: \(V_b \propto A^{-0.5}\), where \(A\) is electrode area.
-
Typical improvement factors: 2-10x increase in breakdown voltage.
-
Surface roughness specifications: \( R_a < 0.1 \, \mu\text{m} \) for optimal performance.
-
Outgassing rates:
-
Before conditioning: \(10^{-6}\) torr·L/(s·cm²)
-
After conditioning: \(10^{-9}\) torr·L/(s·cm²)
-
-
Conditioning effectiveness depends on electrode material and surface preparation.
-
Laser conditioning:
-
Pulsed laser ablation removes surface contaminants
-
Selective removal of micro-projections
-
Precise control over surface modification
-
-
Ion bombardment conditioning:
-
Ar\(^+\) or Ne\(^+\) ion sputtering
-
Removes surface layers with contaminants
-
Creates atomically clean surfaces
-
-
Chemical conditioning:
-
Controlled oxidation followed by reduction
-
Reactive gas cleaning (e.g., \(H_2\) at elevated temperature)
-
-
Electropolishing: Electrochemical surface smoothing.
-
In-situ monitoring: Real-time current measurement during conditioning.
Effect of Pressure on Breakdown
-
Small gaps (\( < 1 \, \text{mm} \), \( 1 \times 10^{-2} \, \text{torr} \) to \( 1 \times 10^2 \, \text{torr} \)): No change in breakdown voltage due to collision-free electron paths.
-
Large gaps (20 cm): Pressure variation significantly lowers withstand voltage due to increased collision probability.
-
Higher pressures introduce gas molecules, reducing mean free path and enabling ionization.
-
Approximate relation: \(V_b \propto P^{-0.1}\) for large gaps, where \(P\) is pressure.
-
Residual gas composition affects breakdown characteristics:
Gas Ionization Potential (eV) Relative Effect \(H_2\) 15.4 High \(H_2O\) 12.6 Medium \(N_2\) 15.6 High \(O_2\) 12.1 Medium \(CO\) 14.0 Medium-High \(CO_2\) 13.8 Medium-High -
Electronegative gases (\(O_2\), \(H_2O\)): Electron attachment reduces avalanche.
-
Noble gases: Higher breakdown voltages due to high ionization potentials.
-
Partial pressure effects: Most harmful gas determines breakdown characteristics.
-
Gas evolution: Electrode heating → increased gas pressure → reduced breakdown strength.
-
Vacuum interrupter specifications:
-
Operating pressure: \(< 10^{-4}\) torr
-
Contact gap: 8-20 mm
-
Withstand voltage: 50-200 kV
-
-
Maintenance requirements: Vacuum monitoring, leak detection.
-
Economic advantages: No gas handling, environmental friendliness.
-
Life cycle: 20-30 years with proper maintenance.
Practical Design Considerations
-
Key design parameters:
-
Pumping speed: S (L/s)
-
Conductance: C (L/s)
-
Leak rate: Q (torr·L/s)
-
-
Ultimate pressure: \(P = \frac{Q_{leak} + Q_{outgas}}{S_{eff}}\)
-
Seal technology: Metal gaskets, elastomer O-rings, glass-to-metal seals.
-
Getter materials maintain vacuum by absorbing residual gases:
Getter Type Operating Temp. (\(^{\circ}\mathrm{C}\)) Pumping Speed Titanium 400-600 High for \(O_2\), \(N_2\) Barium 300-500 Excellent for \(H_2O\) Zirconium 500-700 Good for \(H_2\) -
Vacuum measurement techniques:
-
Pirani gauge: \(10^{-4}\) to 1 torr (thermal conductivity)
-
Ion gauge: \(10^{-10}\) to \(10^{-3}\) torr (ionization)
-
Capacitance manometer: \(10^{-5}\) to 1000 torr (absolute)
-
-
Leak detection: Helium mass spectrometry, sensitivity \(< 10^{-10}\) torr·L/s.
-
Outgassing rate target: \(< 10^{-9}\) torr·L/(s·cm2) for UHV applications.
Conclusion
-
Vacuum breakdown differs fundamentally from gas discharge due to large mean free path and electrode-derived particle emission.
-
Cold cathode discharge with cathode spots serves as the primary mechanism driving vacuum arcs.
-
Non-metallic emissions, surface contamination, and clump mechanisms significantly reduce breakdown strength.
-
Electrode conditioning through various methods (glow discharge, heating, spark conditioning) substantially enhances breakdown performance.
-
Pressure effects on breakdown voltage vary significantly with electrode gap dimensions and residual gas composition.
-
Vacuum technology offers superior dielectric strength and environmental advantages for high-voltage applications.
-
Future developments focus on advanced materials, improved conditioning techniques, and enhanced reliability for next-generation vacuum interrupters.