Introduction to Solid Dielectrics
-
Solid insulating materials are integral in electrical equipment (e.g., transformers, generators, circuit breakers, cables).
-
Primary Functions:
-
Provide electrical insulation between live parts and grounded structures
-
Offer mechanical support and structural integrity
-
Environmental protection
-
-
Used in combination with liquid and gaseous insulations in composite systems.
-
Common Materials: Ceramics, polymers, glass, mica, paper, rubber
Critical Breakdown Characteristic
Unlike gases (fast recovery) and liquids (partial recovery), solids suffer permanent damage and lose dielectric strength completely upon breakdown.
-
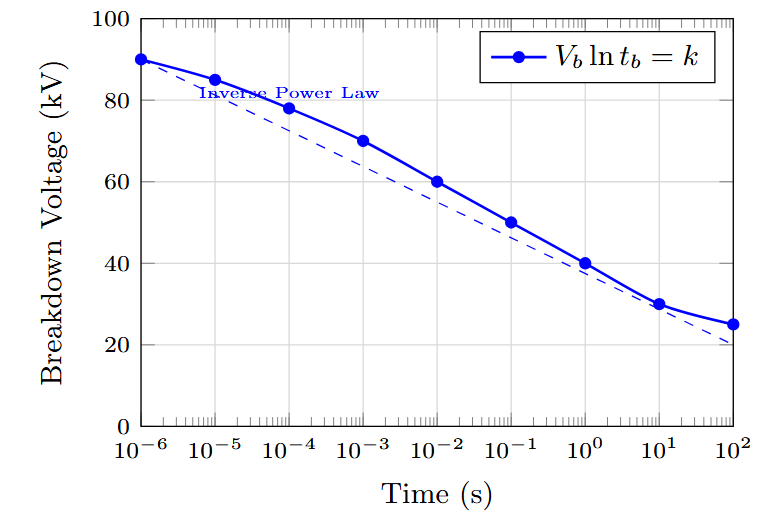
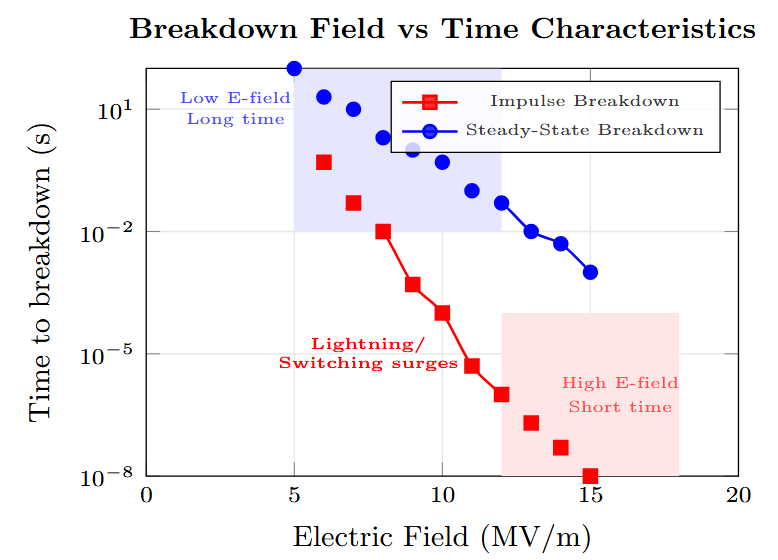
Breakdown depends on both voltage magnitude and application time
-
Empirical relation:
\[V_b \ln t_b = \text{constant}\] -
Longer application times require lower voltages for breakdown
-
Important for insulation design and testing protocols
Environmental Factors:
-
Ambient temperature (\(\mathrm{T}~ \uparrow~\to~ \mathrm{strength}~\downarrow\) )
-
Humidity and moisture content
-
Atmospheric pressure
Material Factors:
-
Impurities and structural defects
-
Material thickness and geometry
-
Age and degradation history

Electrical Factors:
-
Type of voltage (AC, DC, impulse)
-
Frequency of applied voltage
-
Duration of voltage application
-
Electrode configuration and pressure
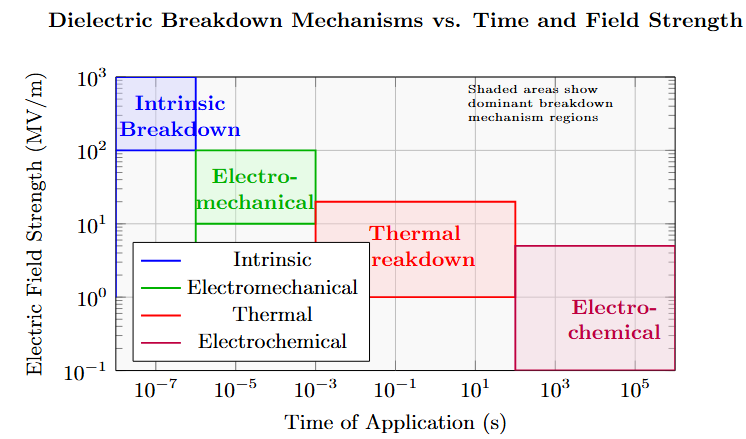
Five Primary Breakdown Mechanisms
-
Intrinsic Breakdown - Electronic avalanche in pure materials
-
Electromechanical Breakdown - Mechanical compression failure
-
Treeing and Tracking - Discharge in voids and surface contamination
-
Thermal Breakdown - Heat-induced conductivity increase
-
Electrochemical Breakdown - Chemical degradation over time
Breakdown Mechanisms
Characteristics:
-
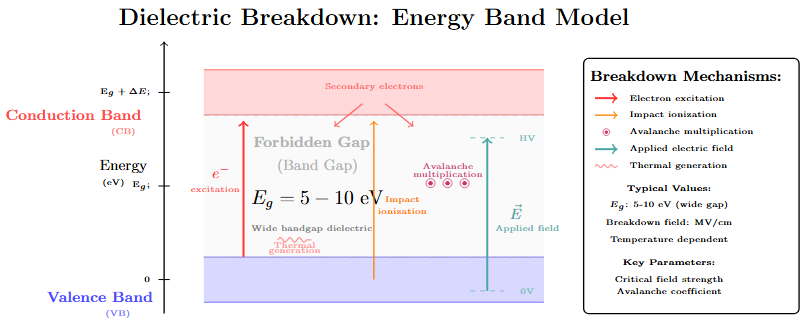
Occurs in pure, homogeneous materials
-
Very short application time (\(\sim 10^{-8}\) s)
-
Represents theoretical upper limit
-
Temperature independent (electronic process)
Mechanism:
-
Electrons gain energy from electric field
-
Cross forbidden energy gap to conduction band
-
Electron avalanche multiplication
-
Critical field: \(E_i = 10^7 - 10^8\) V/m
Intrinsic Dielectric Strength
Materials rarely achieve intrinsic strength in practice due to impurities, defects, and non-uniform fields.
Physical Mechanism:
-
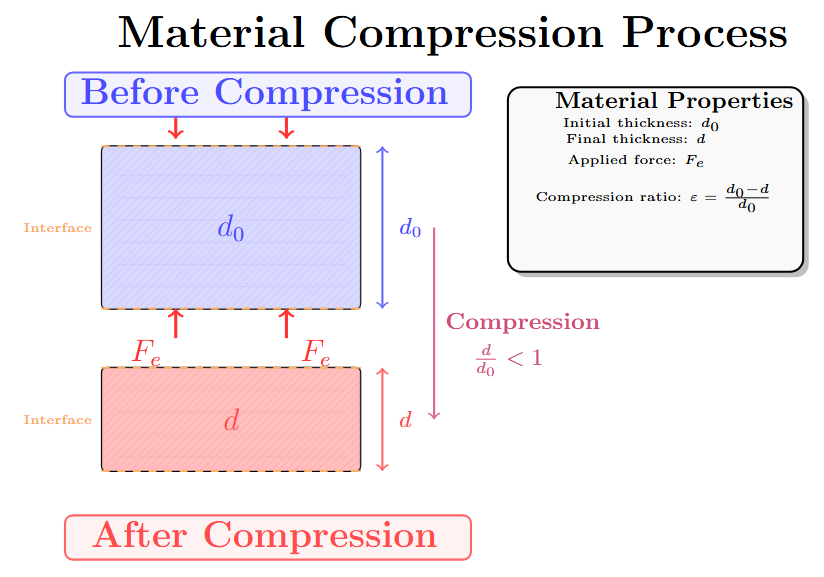
Electrostatic forces compress the dielectric
-
Compressive stress: \(F = \frac{1}{2} \varepsilon_0 \varepsilon_r \frac{V^2}{d^2}\)
-
Material resists with elastic force
-
Breakdown when compression exceeds elastic limit
Mathematical Analysis:
-
Mechanical strength: \(Y \ln \frac{d_0}{d}\)
-
Equilibrium: \(\varepsilon_0 \varepsilon_r \frac{V^2}{d^2} = Y \ln \frac{d_0}{d}\)
-
Maximum compression: \(d = 0.6 d_0\)
Apparent Dielectric Strength
Treeing:
-
Gas-filled voids/cavities in solid
-
Field enhancement: \(E_{gas} = \varepsilon_r \times E_{solid}\)
-
Partial discharge in cavities
-
Tree-like discharge channels grow
-
Eventually bridges electrodes
-
Surface contamination (moisture, salt, dust)
-
Leakage current flows on surface
-
Carbonization creates conductive path
-
Permanent damage to surface
Impact on Outdoor Insulation
Tracking severely limits the use of organic insulation in outdoor environments due to pollution and moisture.
Heat Generation Sources:
-
Dielectric losses: \(P = \omega C V^2 \tan \delta\)
-
Conduction current: \(P = I^2 R = \sigma E^2 V\)
-
Partial discharge losses
Thermal Instability:
-
Temperature rise increases conductivity
-
Higher conductivity → more heat generation
-
Positive feedback loop leads to thermal runaway
-
Critical when: Heat Generated > Heat Dissipated

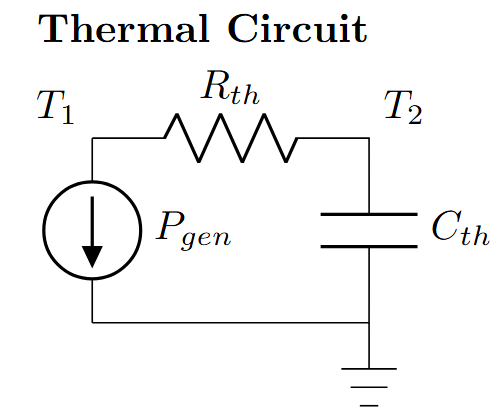
Heat Flow Equation
Impulse Case (No Heat Dissipation):
With \(\sigma = \sigma_0 e^{-\frac{u}{kT}}\) and linear field rise:
Result: Critical field \(E_c\) independent of critical temperature.
Steady-State Case:
For thick slab with constant surface temperature:
Result: Minimum breakdown voltage exists.
| Material | DC (MV/cm) | AC (MV/cm) |
|---|---|---|
| Ceramics | ||
| HV Steatite | – | 9.8 |
| High grade porcelain | – | 2.8 |
| Polymers | ||
| Ebonite | – | 1.45–2.75 |
| Polythene | – | 3.5 |
| Polystyrene | – | 5.0 |
| Polystyrene at 1 MHz | – | 0.05 |
| Acrylic resins | – | 0.3–1.0 |
| Natural Materials | ||
| Mica (muscovite) | 24 | 7–18 |
| Rock salt | 38 | 1.4 |
| Crystalline | ||
| Quartz (\(\perp\) to axis) | 1200 | – |
| Quartz (\(\parallel\) to axis) | 66 | – |
| Quartz (impure) | – | 2.2 |
Key Observations:
-
DC strength generally higher than AC
-
Frequency effect significant (polystyrene example)
-
Crystal orientation matters (quartz)
-
Purity affects breakdown strength significantly
Mechanism:
-
Long-term degradation process
-
Cavities reduce local dielectric strength
-
Partial discharge creates reactive species
-
Chemical bond breaking by energetic electrons
-
Ion bombardment causes local heating

Chemical Effects:
-
Formation of O\(_2\), O\(_3\), NO\(_2\) in air-filled voids
-
Oxidation of organic materials
-
Polymer chain scission
-
Formation of carbonized tracks
Empirical Relation:
Testing Implications
High AC voltage testing avoided for aged equipment. Very low frequency (0.1 Hz) testing preferred to minimize electrochemical effects during testing.
Practical Considerations
Material Selection:
-
Choose materials based on operating conditions
-
Consider temperature, humidity, contamination
-
Match thermal expansion coefficients
-
Ensure adequate mechanical strength
Design Practices:
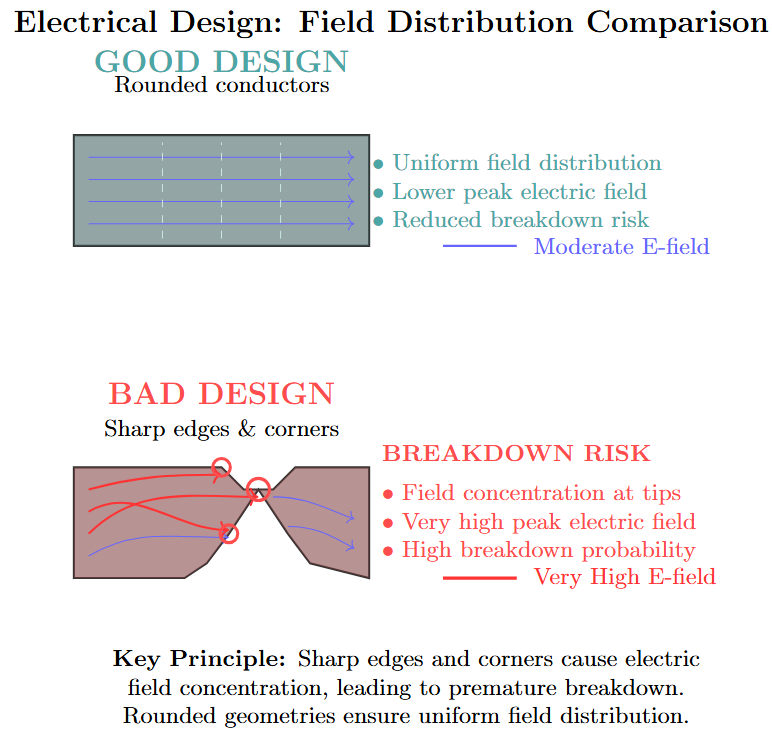
-
Minimize field concentrations
-
Proper stress grading
-
Avoid sharp edges and points
-
Adequate creepage distances
-
Prevent void formation during manufacturing
Prevention Strategies:
-
Intrinsic: Use high-purity materials, minimize defects
-
Electromechanical: Control electrode pressure, use flexible materials
-
Treeing: Vacuum impregnation, void-free processing
-
Thermal: Improve heat dissipation, temperature monitoring
-
Electrochemical: Moisture control, protective coatings
Standard Test Methods:
-
AC Tests: 50/60 Hz, power frequency
-
DC Tests: For DC applications, slower stress
-
Impulse Tests: Lightning and switching surges
-
Step-stress Tests: Progressive voltage increase
-
Long-term Tests: Life assessment (1000+ hours)

Test Considerations:
-
Temperature control (±2°C)
-
Humidity conditioning
-
Electrode configuration standardization
-
Sample preparation (thickness, surface finish)
-
Statistical analysis (Weibull distribution)
Key Standards
IEC 60243: Electric strength of insulating materials
ASTM D149: Dielectric breakdown voltage and strength
IEEE Std 4: High-voltage testing techniques
Emerging Materials:
-
Nanocomposites (enhanced properties)
-
Bio-based insulation materials
-
High-temperature ceramics
-
Aerogel insulators
-
Functionally graded materials
Current Challenges:
-
Renewable energy applications
-
HVDC transmission requirements
-
Miniaturization demands
-
Environmental regulations
-
Recycling and sustainability
Advanced Diagnostics:
-
Partial discharge monitoring
-
Dielectric spectroscopy
-
Thermography
-
Acoustic emission
-
AI-based condition assessment
Summary
Five Breakdown Mechanisms
-
Intrinsic: Electronic avalanche in pure materials (ns timescale)
-
Electromechanical: Mechanical failure under electrostatic stress
-
Treeing/Tracking: Discharge in voids and surface contamination
-
Thermal: Heat-induced conductivity increase and runaway
-
Electrochemical: Long-term chemical degradation (years)
Critical Design Factors:
-
Material purity and processing
-
Field distribution uniformity
-
Temperature and humidity control
-
Mechanical stress management
-
Long-term aging considerations
Engineering Applications:
-
Power cable insulation
-
Transformer bushings
-
Circuit breaker chambers
-
Capacitor dielectrics
-
Electronic device encapsulation